Microsoft Excel: A Comprehensive Guide
Introduction to Microsoft Excel
Microsoft Excel is a powerful spreadsheet application developed by Microsoft and is part of the Microsoft Office suite. It is widely used for data analysis, calculation, visualization, and automation across various industries, including business, finance, engineering, education, and research.
Excel provides users with a flexible and dynamic way to organize data, create reports, perform complex calculations, and automate repetitive tasks. Xcel’s functionality extends far beyond simple number crunching. It includes a vast range of tools for data organization, chart creation, statistical analysis, and even programming through Visual Basic for Applications (VBA). With its user-friendly interface and advanced capabilities, Excel is an essential tool for professionals and students alike.
Whether you’re a student, accountant, business owner, researcher, or analyst, chances are Excel has a role in your work. This analysis introduces Excel, explains its core features, and explores why it remains essential in today’s data-driven world.
Table of Contents
1. Structure and Components of Excel
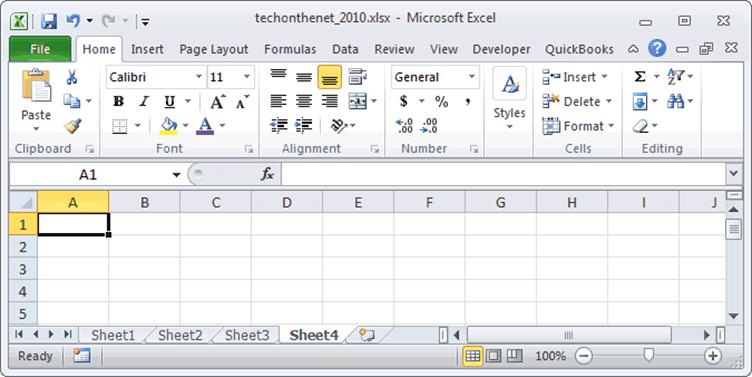
1.1 Workbooks and Worksheets
An Excel file is known as a workbook, which can contain multiple worksheets (also called spreadsheets). Each worksheet is an individual page within the workbook, consisting of a grid made up of rows and columns. The intersection of a row and column is called a cell, where users can enter and manipulate data.
- Rows are labelled numerically (1, 2, 3, etc.).
- Columns are labelled alphabetically (A, B, C, etc.).
- Cells are referenced by a combination of their column letter and row number (e.g., A1, B2, C3)
1.2 Data Types
Excel supports various data types, including:
- Text (Strings) – Used for labels, names, and non-numeric information.
- Numbers (Integers, Decimals, Currency, Percentages) – Used for calculations and financial data.
- Dates and Time – Supports formatting for dates and time stamps.
- Boolean Values (TRUE/FALSE) – Used for logical operations.
- Formulas and Functions – Enables calculations based on cell values
- Data Entry, Formatting, and Validation
- 2.1 Data Entry
Formatting Options
Excel provides various formatting options to enhance data presentation, including:
- Font styles, sizes, and colors
- Cell borders and shading
- Text alignment (left, center, right, wrap text)
- Conditional Formatting – Highlights cells based on specific rules (e.g., color-coding high and low values).
Data Validation
Data validation ensures accuracy and consistency in data entry by setting constraints such as:
- Dropdown lists
- Numeric range limits
- Text length restrictions
- Custom validation rules
Formulas and Functions
- Excel is equipped with powerful formulas and functions that enable users to perform simple and complex calculations efficiently.
Basic Formulas
- Addition: =A1+B1
- Subtraction: =A1-B1
- Multiplication: =A1*B1
- Division: =A1/B1
Data Analysis and Visualization
4.1 Charts and Graphs
Excel provides a variety of charts and graphs to visualize data, including:
- Bar Charts
- Pie Charts
- Line Charts
- Scatter Plots
- Pivot Charts
- Sparklines
What-If Analysis
Excel provides What-If Analysis tools to evaluate different scenarios, including:
- Goal Seek – Finds the necessary input to achieve a desired result.
- Data Tables – Analyses how changing one or two variables affects calculations.
- Solver – Optimizes complex equations to achieve specific objectives.
. Collaboration and Cloud Integration
Excel integrates with cloud services like OneDrive and SharePoint, allowing users to collaborate in real-time. Key collaboration features include:
- Simultaneous editing by multiple users
- Commenting and notes on cells
- Version history tracking
Data Management and Analysis
- Database creation and data visualization
- Customer relationship management (CRM)
- Inventory management
Engineering and Science
- Statistical analysis and regression models
- Data simulations and experiments
- Scientific data visualization
Education and Training
- Student grade tracking
- Lesson planning and scheduling
- Research data analysis
Conclusion
Microsoft Excel is a versatile and powerful tool used by individuals and organizations worldwide. With its extensive set of features for data management, analysis, visualization, and automation, Excel enhances productivity and decision-making across various fields. Whether you are a beginner or an advanced user, mastering Excel can provide significant advantages in both personal and professional environments


2 Comments
Your blog has become an indispensable resource for me. I’m always excited to see what new insights you have to offer. Thank you for consistently delivering top-notch content!
Thank for comment